100% FREE ONLINE DATING
sponsored links
| Topic: what Makes up the Deficit That We're all Hyperventilating Ab | |
|---|---|

|
|
|
Here is a great chart that shows us the composition of our deficit. It should accompany every discussion.
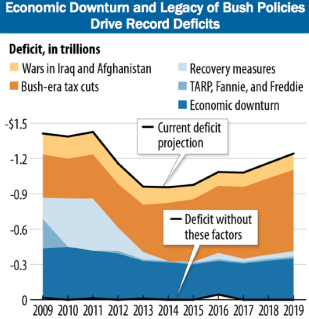
http://www.theatlantic.com/politics/archive/2011/05/the-chart-that-should-accompany-every-discussion-of-deficits/238786/ |
|
|
|
|

|
|
|
Here is a great chart that shows us the composition of our deficit. It should accompany every discussion.
http://www.theatlantic.com/politics/archive/2011/05/the-chart-that-should-accompany-every-discussion-of-deficits/238786/ Uhh. this is kind of not anything at all. What about all the money the government is spending? This shows nothing about government spending outside what is listed on the chart. I guess thats the only thing the government spends money on right? |
|
|
|
|

|
|
|
Here is a great chart that shows us the composition of our deficit. It should accompany every discussion.
http://www.theatlantic.com/politics/archive/2011/05/the-chart-that-should-accompany-every-discussion-of-deficits/238786/ Uhh. this is kind of not anything at all. What about all the money the government is spending? This shows nothing about government spending outside what is listed on the chart. I guess thats the only thing the government spends money on right? from the context of the op, although its not specifically stated by his words, I would imagine that anything not listed specifically is included in the section marked 'deficit without these factors',, which probably includes the other 'government spending' but thats just a guess,,,perhaps the op will clarify |
|
|
|
|

|
|
|
Question:
How can a tax cut be considered part of the debt? That isn't money that was borrowed. It is money that wasn't collected. How can you say you owe money because you didn't collect it. That doesn't make any sense. Same logic Clinton used when he scrapped some new plans that would add to the deficit. By deciding not to spend money he said that he saved money. That would be like me saying I am going to buy a car for $150,000. Wait, I can't afford that car. By deciding not to buy it, I now have saved $150,000. That isn't true. I still don't have the $150,000 I didn't have before. How is that a savings? Same thing applies to saying a tax cut is an actual expense. A drop in revenue does not equal an expense. Love how the chart shows the trillion dollar relief effort is just a minor part of the deficit. But that is only the interest payments you see on this chart. That is all political accounting which no reputable accountant would accept. Actually, any company that did this which received public funds would not be allowed to stay in business. They would have questionable business practices and you would hear politicians saying how this company is stealing your money. "That is the real evil in our country. Not us." |
|
|
|
|

|
Edited by
willing2
on
Mon 06/20/11 06:36 AM
|
|
I would suggest that any progressive who is hyperventilating over the deficit use a plastic bag instead of paper.
That would not only help cure the deficit, it would help lower the unemployment levels. I forgot;   
|
|
|
|
|
|
|
|
|
Uhh.
Uhh, Msharmony understood the graph. It clearly says that without those expenses, the deficit would be "0' How can a tax cut be considered part of the debt?
You don't understand this? You don't understand that, if your pay check were cut in half, but that you still continued paying y9our mortgage, health insurance, car payments and food bills, you might develop some shortfall? |
|
|
|
|

|
|
|
I haven't seen numbers concerning tax-revenue lost from the tax cuts, or from the economic downturn. I also note the source is The Atlantic, which though reputable does have some bias.
That being said, here is the budget from 2010. Tax revenues collected were just over $2.2 trillion, little more than needed to cover mandatory spending, which includes the largest entitlement programs. Mandatory spending: $2.173 trillion (+14.9%) $695 billion (+4.9%) – Social Security $571 billion (+58.6%) – Other mandatory programs $453 billion (+6.6%) – Medicare $290 billion (+12.0%) – Medicaid $164 billion (+18.0%) – Interest on National Debt US receipt and expenditure estimates for fiscal year 2010. Discretionary spending: $1.378 trillion (+13.8%) $663.7 billion (+12.7%) – Department of Defense (including Overseas Contingency Operations) $78.7 billion (−1.7%) – Department of Health and Human Services $72.5 billion (+2.8%) – Department of Transportation $52.5 billion (+10.3%) – Department of Veterans Affairs $51.7 billion (+40.9%) – Department of State and Other International Programs $47.5 billion (+18.5%) – Department of Housing and Urban Development $46.7 billion (+12.8%) – Department of Education $42.7 billion (+1.2%) – Department of Homeland Security $26.3 billion (−0.4%) – Department of Energy $26.0 billion (+8.8%) – Department of Agriculture $23.9 billion (−6.3%) – Department of Justice $18.7 billion (+5.1%) – National Aeronautics and Space Administration $13.8 billion (+48.4%) – Department of Commerce $13.3 billion (+4.7%) – Department of Labor $13.3 billion (+4.7%) – Department of the Treasury $12.0 billion (+6.2%) – Department of the Interior $10.5 billion (+34.6%) – Environmental Protection Agency $9.7 billion (+10.2%) – Social Security Administration $7.0 billion (+1.4%) – National Science Foundation $5.1 billion (−3.8%) – Corps of Engineers $5.0 billion (+100%-NA) – National Infrastructure Bank $1.1 billion (+22.2%) – Corporation for National and Community Service $0.7 billion (0.0%) – Small Business Administration $0.6 billion (−14.3%) – General Services Administration $0 billion (−100%-NA) – Troubled Asset Relief Program (TARP) $0 billion (−100%-NA) – Financial stabilization efforts $11 billion (+275%-NA) – Potential disaster costs $19.8 billion (+3.7%) – Other Agencies $105 billion – Other This was the proposed budget for 2010, not the final expenditures, yet there was still a shortfall of about $1.3 trillion. The percentages in parentheses indicate changes from the previous year's budget. |
|
|
|
|
|
|
|
|
So, the wars, the Bush tax cuts, the recovery measures, TARP, freddie and Fanny and the major recession served a pretty practical purpose for those who hate all that "wasteful" spending. The tax cuts, especially.
|
|
|
|
|
|
|
|
|
So, the wars, the Bush tax cuts, the recovery measures, TARP, freddie and Fanny and the major recession served a pretty practical purpose for those who hate all that "wasteful" spending. The tax cuts, especially. Really? I would think that in a bad economy people need their money more thus tax cuts would be beneficial. Government should cut spending not raise taxes. Bush tax cuts only lowered what Clinton raised. In fact they are still higher than pre Clinton. |
|
|
|
|
|
|
|
|
I agree! People who are taking home fewer that 250,000 lifestyle dollars should definitely get a tax break. Those who are taking home more than that are having no problem with the bad economy at all. In fact, they are just getting richer and richer.
|
|
|
|
|
|
|
Edited by
mylifetoday
on
Mon 06/20/11 06:00 PM
|
|
Uhh.
Uhh, Msharmony understood the graph. It clearly says that without those expenses, the deficit would be "0' How can a tax cut be considered part of the debt?
You don't understand this? You don't understand that, if your pay check were cut in half, but that you still continued paying y9our mortgage, health insurance, car payments and food bills, you might develop some shortfall? You misunderstand. The reporting of a loss of income as an expense would be fraud by any other organization. And yet, for some reason everyone accepts this as valid information in politics. The only purpose this graph serves is to cast blame for the shortfalls on everyone except the people responsible. Spend more than you make and you have debt accumulation. This graph is trying to say that they should be allowed to spend this much but Bush caused the problems. Simple fact is the government does not live within their means and always blames the previous administration for their current inability to function within a balanced budget. No one is forcing them to spend this much. Therefore the people responsible for this debt are the people that authorize the current expenditures. How dumb are they trying to blame Bush for their current decisions. They could balance the budget. It has been done before, but you need a strong leader to make it happen. No one wants to be the bad guy. And what the hey, it's not their money. |
|
|
|
|
|
|
|
|
I agree! People who are taking home fewer that 250,000 lifestyle dollars should definitely get a tax break. Those who are taking home more than that are having no problem with the bad economy at all. In fact, they are just getting richer and richer. So a person making 240,000 really needs that money but 250,000 doesnt? They already pay the highest percentage. I think its absurd that you should have to pay even more. If they are earning more money they are taxed on more. They have more property and they are taxed on that as well. ETC. |
|
|
|
|

|
|
|
Here is a great chart that shows us the composition of our deficit. It should accompany every discussion.
http://www.theatlantic.com/politics/archive/2011/05/the-chart-that-should-accompany-every-discussion-of-deficits/238786/ The only purpose of this graph is to try to blame Bush for what the government is doing NOW! A proper name for the graph would be ... What happened the day Obama took office. |
|
|
|
|

|
|
|
Here is a great chart that shows us the composition of our deficit. It should accompany every discussion.
http://www.theatlantic.com/politics/archive/2011/05/the-chart-that-should-accompany-every-discussion-of-deficits/238786/ The only purpose of this graph is to try to blame Bush for what the government is doing NOW! A proper name for the graph would be ... What happened the day Obama took office. That's funny because I just realized that even though the written words take issue with what Bush did, none of the Bush years are represented on the graph. I suppose that was because the $600 billion to $1.4 trillion was a little too steep of a line to draw. Even though 2009 was actually the last budget on Bush's watch the huge spike in the deficit was the Stimulus Package which still costs more than the combined 8 years of the Iraq war. |
|
|
|
|